
Author(s): Engin UÄUR
Despite the wealth of information offered by digital technologies to us, there is a serious decline in the demand for information about science, art, culture and politics, especially the economy which is very boring to people. In our country where newspaper literacy has been very low for many years, people may be indifferent to the economic news that concerns our country and the individual. Information(infogarafik) used to present information in a short period of time, especially in long texts in educational materials, is now used in all visual communication products. It has long been known by communication professionals that information is much easier and more efficient with visuals, but it has not been widely used. However, it has been used as an alternative to today's time constraints and a multitude of information. Due to the responsibility to transfer the information contained in the long text of the information, The design needs to be done very well. An infographic consisting of sloppy, mixed and unsuitable images is very difficult to draw the expected attention. The preparation and design of the most appropriate images for infographic needs to have artistic skills and a good graphic design infrastructure. In this article, the performance of randomly selected infographics from economic pages of different dates in terms of graphic design was evaluated. Evaluations have been accepted all over the world and have been conducted within the framework of long-term concepts and technical knowledge. But these personal assessments are open to any criticism.

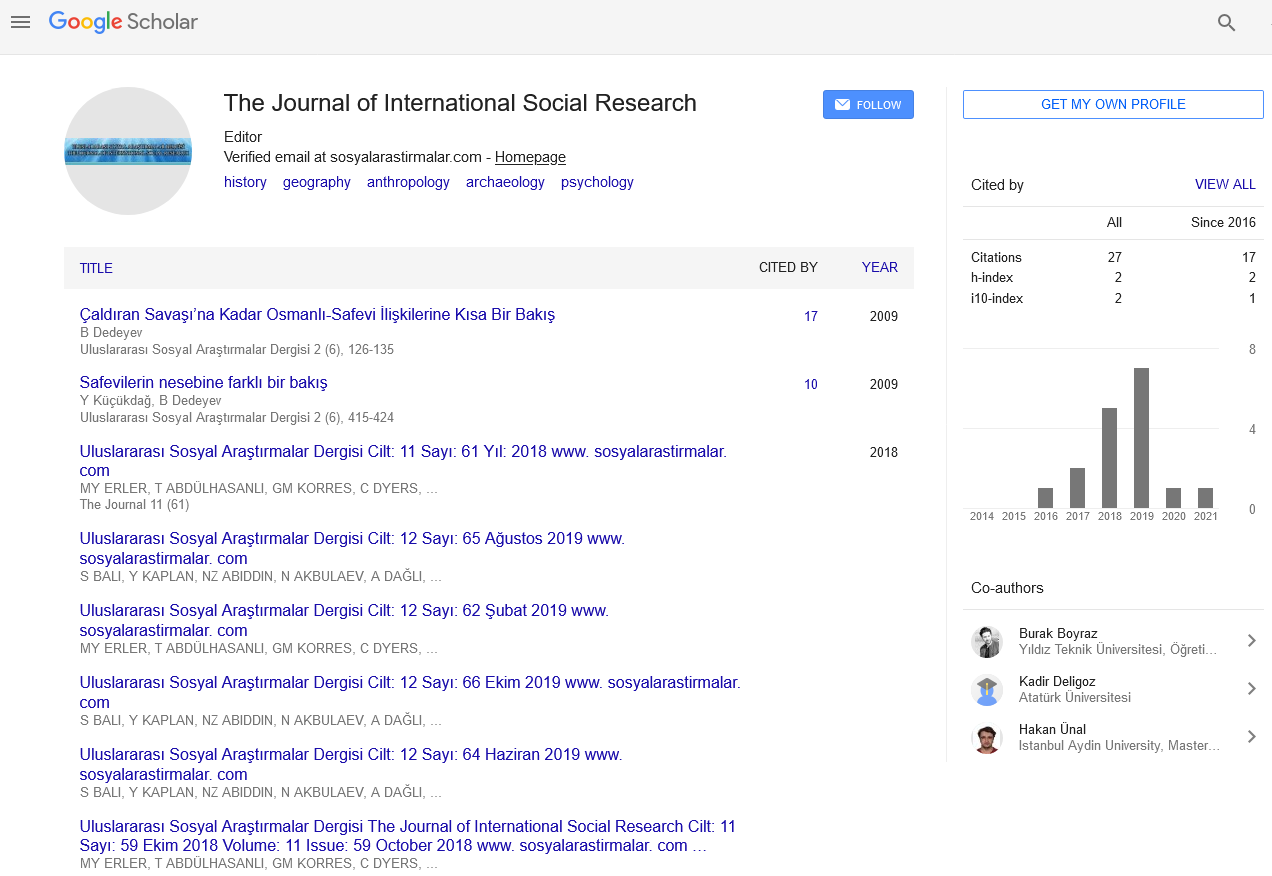
The Journal of International Social Research received 8982 citations as per Google Scholar report